Blog Related Files and Content
Fixed-Window Charting in Power BI: Auto-Adjusting Calendar Periods - 1/28/2025
Learn how to create a chart that always displays the same number of calendar periods, driven by slicer period selection, and regardless of if there is existing data (yet) for a period. This leverages a [DAX] generated table, relationships, and some auto-magic features. Tune in to learn more!
Creating a Dynamic Label Toggle Button Using ONE VISUAL! - 1/14/2025
Learn how to leverage the newer tile slicer (thanks #PBICoreVisuals Team!), a bit of [DAX] Magic, and some clever techniques to create a single button toggle slicer using only a single visual! Plus, this single button even has a dynamic (on/off) label. Tune in to learn more!
Waterfall Charts with Categories (and Considerations...) - 1/7/2025
As a follow up to a my previous video on creating an enhanced vertical/horizontal waterfall chart. In this video I'm going to show you that it's "possible" to create a categorical waterfall chart, but with a few considerations and caveats. Tune in to learn more!
Power BI Upgrade: Easy Vertical Waterfall Charts with Visual Calcs - 12/10/2024
Learn how to build a dynamic vertical waterfall chart using Power BI's native stacked column visual and visual calculations. This step-by-step tutorial covers setting up the data, creating measures using the RUNNINGSUM() function, and handling common challenges such as cumulative calculations and visual formatting. Perfect for showcasing trends, financial analysis, or any scenario requiring clear visualization of increases and decreases over time.
More Variance Comparisons to Stacked Column Charts - 11/26/2024
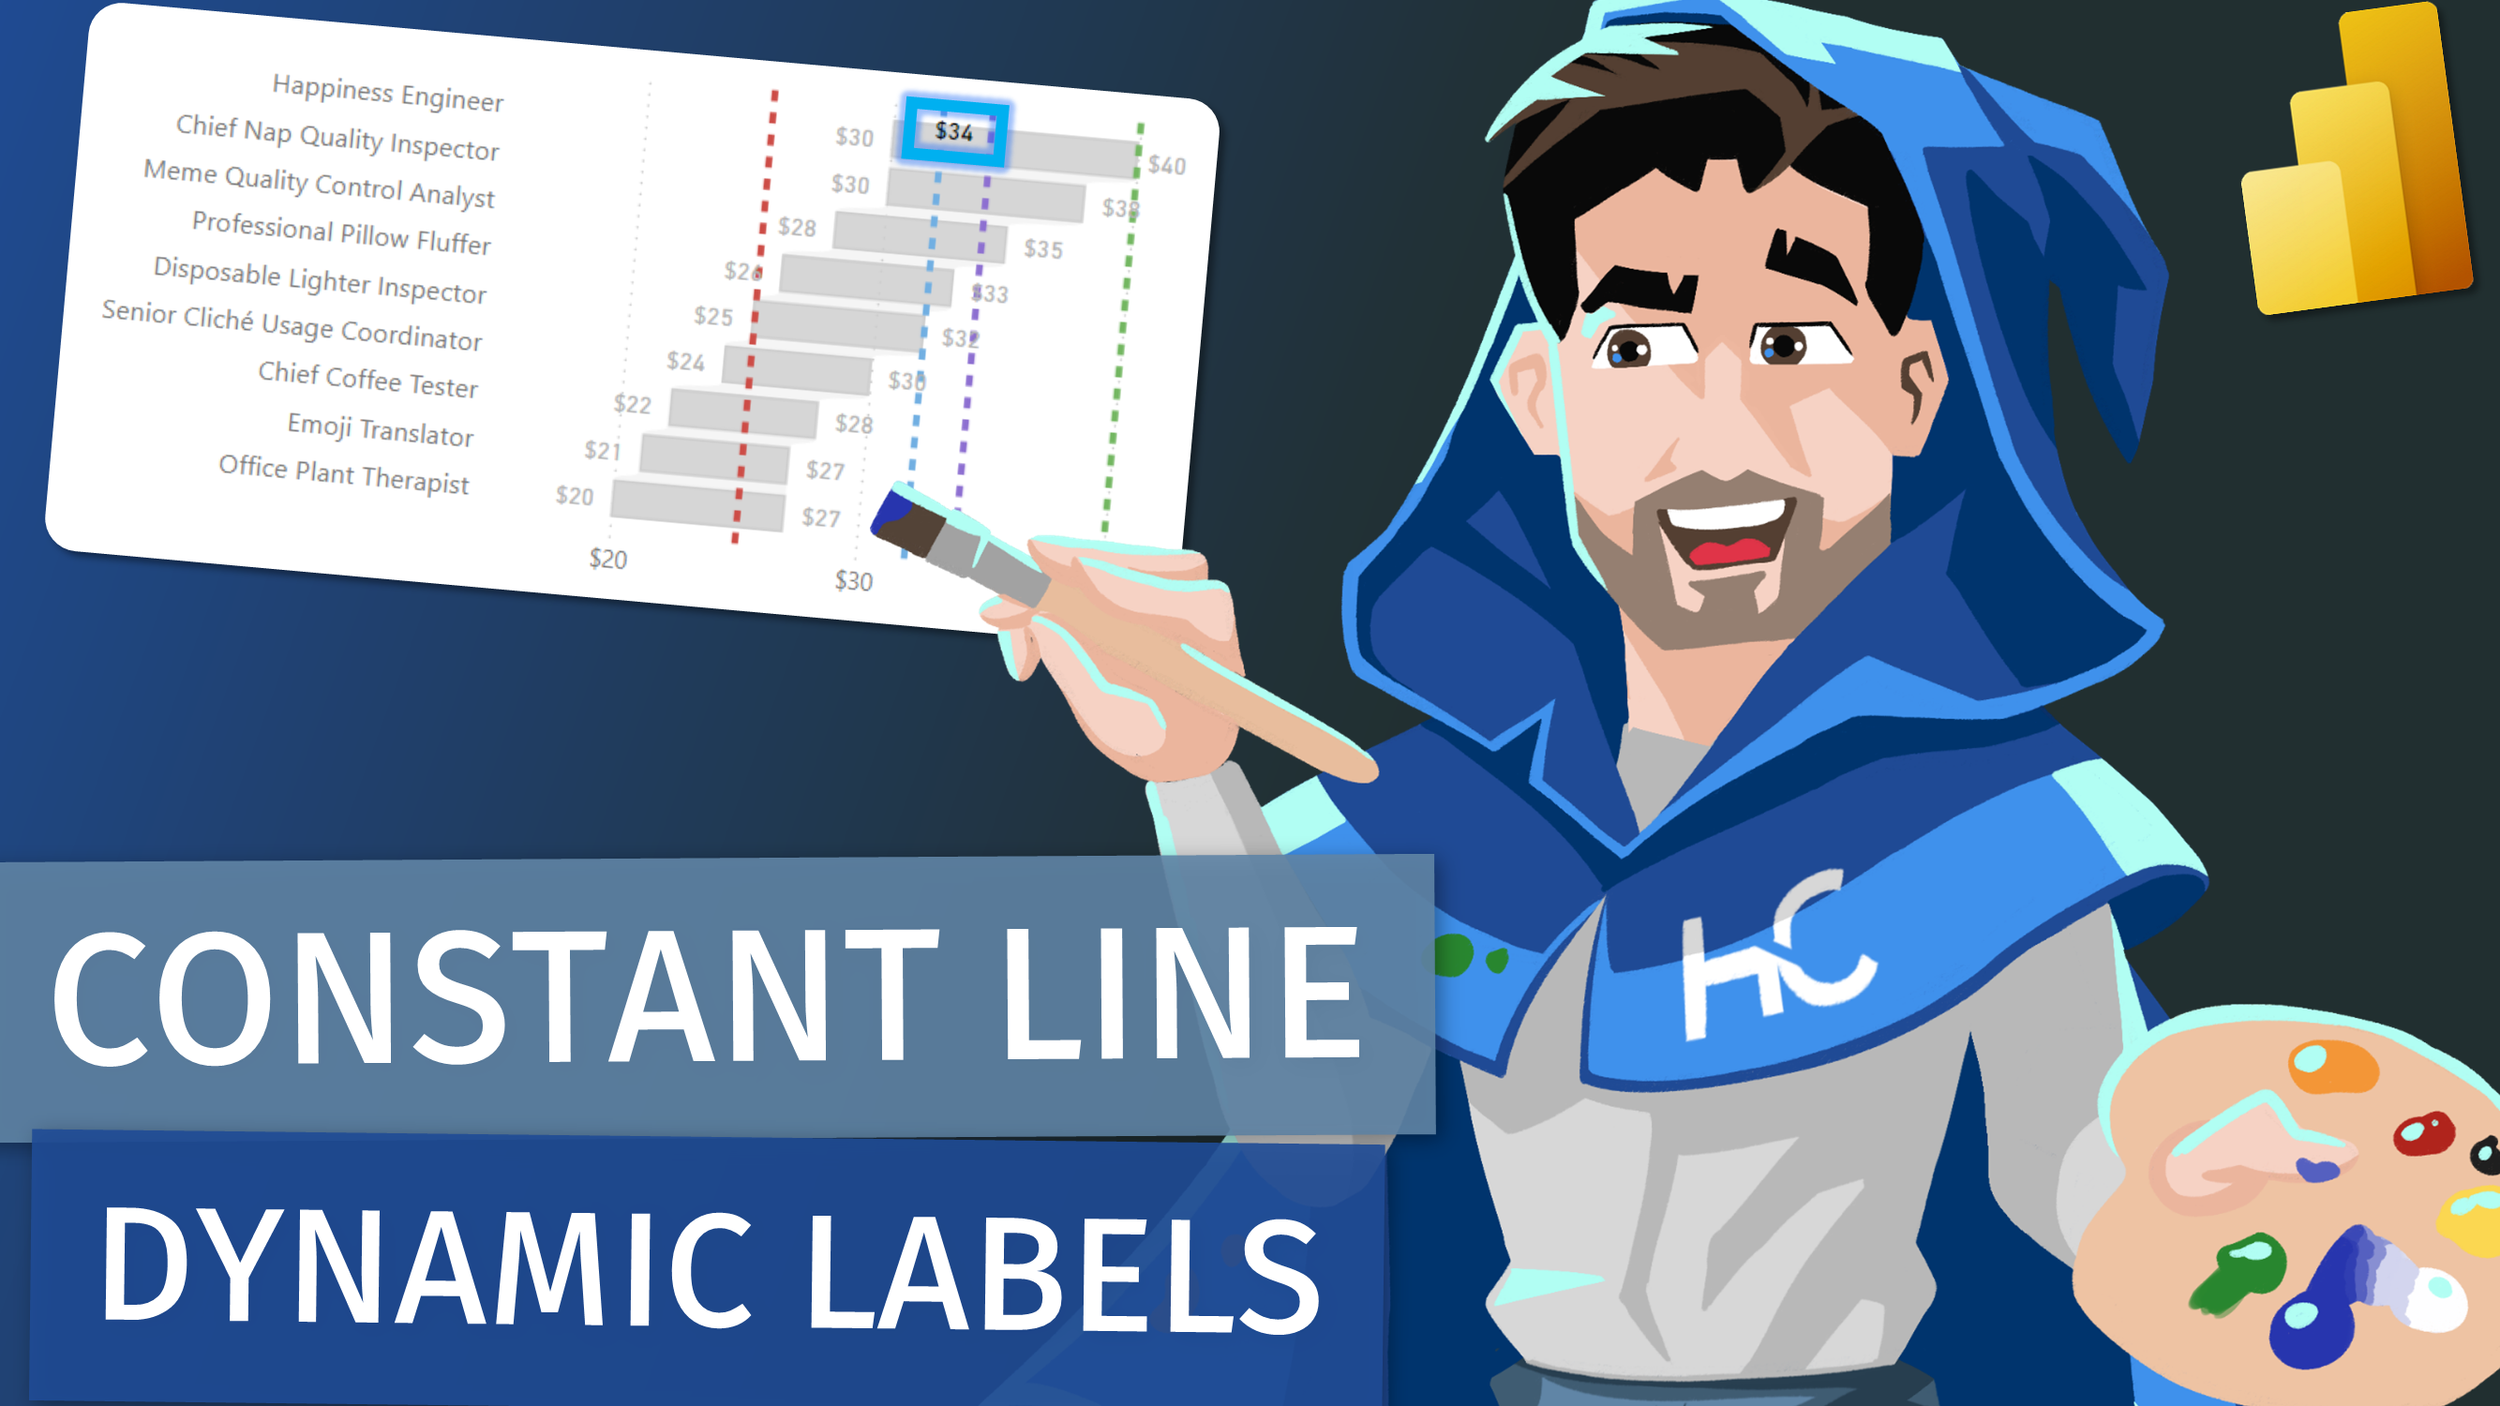
Learn how to create a dynamic constant line data label using a disconnected slicer and some [DAX] magic for Power BI. Tune in to learn more!
Creating [DAX] SVG Charts using Chat GPT! - 11/19/2024
Learn how to leverage the POWER of Chat GPT to generate any SVG chart you can imagine, as a [DAX] measure for tables and matrix native visuals in Power BI Desktop. Tune in to learn more!
Creating a Range Bar with a Native Visual! - 11/12/2024
Learn how to turn a stacked column chart into a range bar, that even includes left and right range data labels. Tune in to learn more!
More Variance Comparisons to Stacked Column Charts - 10/16/2024
Learn of a few more designs, methods, and techniques for adding comparison variance values to stacked column charts. Currently native stacked columns don’t support adding direct (error bar) comparisons. So this technique uses a combo chart to achieve it’s result. Tune in to learn more!
Examples for Comparing Values (Ratios) to Targets - 10/08/2024
Learn about some alternative examples on how to compare targets to ratio percentages using native visuals and a bit of design magic. Tune in to Learn More!
Improving Value Comparisons for Line Charts - 09/24/2024
Learn how to combine a bit of DAX magic with visual features such as error bands to improve comparing values between each other on native line chart visuals in Power BI. Tune in to learn more!
Dynamic Rank Conditional Formatting for Tables in Power BI - 08/27/2024
Learn how to combine some DAX modeling design + conditional formatting data bars to unify values between the min/max bar sizes. Tune in to learn more!
Conditional Formatting Integrated Bar Upgrades! - 08/20/2024
Learn how to combine some DAX modeling design + conditional formatting data bars to unify values between the min/max bar sizes. Tune in to learn more!
Different Approach to a Auto-Scaling Date Axis in Power BI - 07/16/2024
Review how to leverage the Performance Analyzer and DAX Query View to uncover hidden complexities in the DAX query plan, and then apply a solution to your DAX code. Tune in to learn more!
Ultimate [DAX] Dynamic Formatting Combo Package! - 07/09/2024
Learn how to create a DAX Calculation Group that can apply dynamic format strings either at the measure-level or the visual-level. This pattern is really useful to be able to have granular control of exactly which measures or visuals you'd like to apply dynamic formatting to. Tune in to learn more!
Cross-Highlighting a Visual Using a Slicer ?!? - 07/02/2024
Learn how to leverage some recent native visual features plus a little bit of [DAX] magic to use a slicer to create a cross-highlight effect on a visual. Cross-highlighting is normally only natively available between visuals, not slicers. So tune into learn more!
Easy-to-Read Multi-Variance Native Visual in Power BI - 06/25/2024
Learn how to combine a series of native visual features to add multiple variance bars/lines to a stacked column chart, leveraging only native visuals. Tune in to learn more!
Different Approach to a Auto-Scaling Date Axis in Power BI - 06/11/2024
Learn about an updated technique I applied after getting inspiration from another YouTube video showing this original technique. This approach achieves the result of a dynamic date axis that scales to your filtered date range, but with less model additions than the original approach. But while still using Field Parameters and some clever DAX. Tune in to learn more!
Comparing Performance Analyzer Data (After Page Optimization) - 06/4/2024
Learn how to interpret and review the Power BI Performance Analyzer data export (JSON). Plus leverage a template I built to let you compare two Performance Analyzer output files to see both the differences in page load time and object (visual) counts. Tune in to learn more!
Learning Advanced Text Filters with the DAX Query View - 05/21/2024
Learn how to review visual query DAX code using the DAX Query View to identify efficient ways to apply advanced text filter techniques. Tune in to learn more!
Best Practices for Integrated Notes & Annotations in Power BI - 05/14/2024
Learn about 6 locations to leave notes, comments, or annotations in Power BI desktop (PBIX) files. This approach covers notes both for report consumers, and model developers, tune in to learn more!
Adding Integrated Bookmark Notes in a Power BI Report - 05/7/2024
The U/I for the Filter Pane in Power BI desktop seems to be initially limited to only TWO advanced filters conditions. But in this you'll learn of a technique to be able to add any number of advanced filters, with no DAX required. Tune in to learn more!
Adding Integrated Bookmark Notes in a Power BI Report - 04/23/2024
Learn how to integrate bookmark notes directly inside of a Power BI desktop file, without needing to manage any separate files or documentation. Tune in to learn more!
Creating a Mult-Value KPI Scorecard with a Native Bar Chart ?? - 04/16/2024
Learn how to use only 4 measures to create a multi-value KPI scorecard visual using a native bar chart in Power BI. This technique is useful while we wait for small multiples to show up for the new (native) card visual in Power BI. Tune in to learn more!
Multi-Line KPI Data Labels for Native Visuals in Power BI !! - 04/09/2024
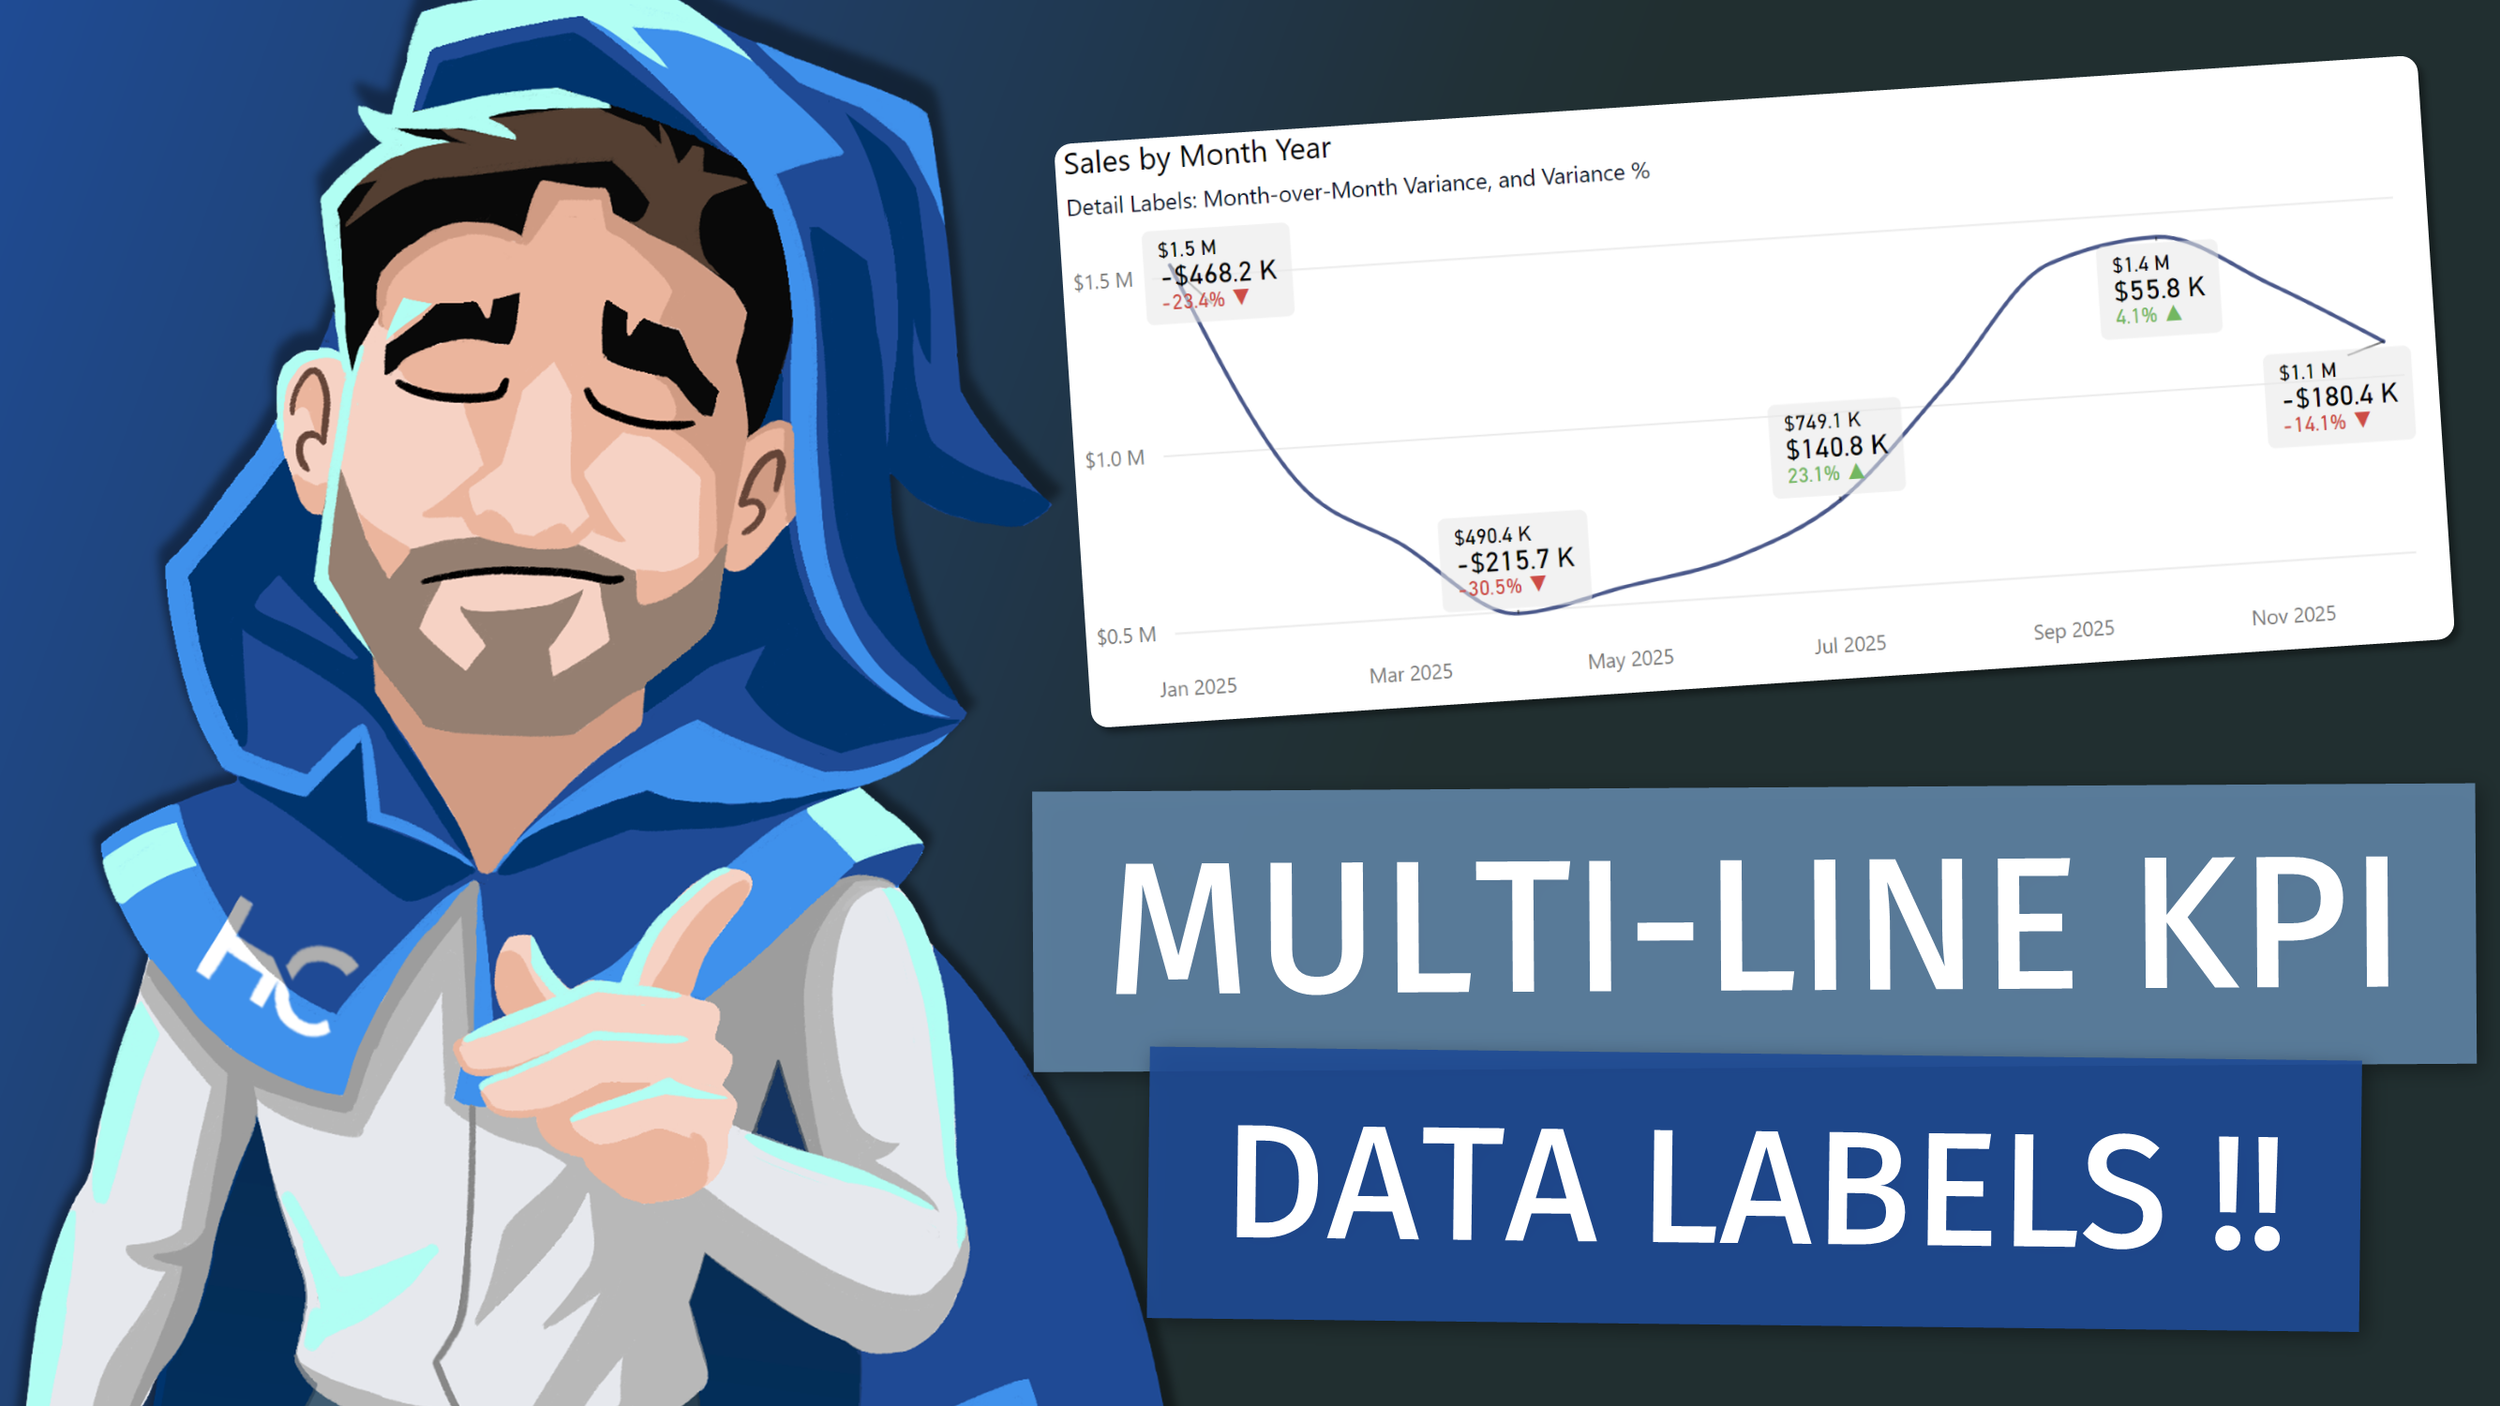
Learn how to create, design, and format multi-line KPI data labels for native visuals in Power BI Desktop. Leveraging a bit of DAX magic and conditional formatting, tune in to learn more!
Explosion Vs Erosion for Stacked Charts in Power BI! - 03/26/2024
Learn about a recently released feature for Power BI that lets you choose how to add spaces between stacked chart categories. Either by "Exploding" or "Eroding" to create those spaces. Each has their pros/cons so tune in to learn more!
Turning Beast to Beauty: Removing Chart Junk in Power BI - 03/19/2024
Have conversation with me as we review the concepts of chart (visualization) junk, and how to remove them, or choose carefully what you'd want to include in a visual in Power BI. Tune in to learn more!
Dynamic Column Headers (with Field Parameters) in Power BI! - 03/12/2024
Learn how to combine Field Parameters, relationships, and DAX to create dynamic "column" headers in Power BI. Tune in to learn more!
Creating a Dual Variance Chart w/ Overlap + Error Bars in Power BI - 02/27/2024
Learn how to turn a native bar or column chart into a variance chart that compares against two values. This technique leverages the new overlap feature (Feb 24 release) + the error bars included with native visuals in Power BI Desktop. Tune in to learn more!
(Case Study) Field Parameters or Calculation Groups??? - 02/13/2024
Dive into a client scenario with me as I compare and contrast the use-cases, benefits, and limitations between Field Parameters and Calculation Groups. Tune in to learn more!
Testing Your Code Using the [DAX] Query View! - 02/06/2024
Learn how to hide all the visual-level filters from field parameter selections on visuals in Power BI. This addresses a problem where not all the field parameter fields will show at once in the visual-level filter list. Tune in to learn more!
Avoiding HIDDEN Visual-Level Filters with Field Parameters - 01/30/2024
Learn how to hide all the visual-level filters from field parameter selections on visuals in Power BI. This addresses a problem where not all the field parameter fields will show at once in the visual-level filter list. Tune in to learn more!
Applying Custom Column Ordering for Field Parameters (Measures) - 01/23/2024
Learn about a technique to to rename columns containing either CamelCase or underscore (_) title formatting in Power Query. This technique was originally posted by Jani Zajc (links below) who collaborated with Gil Raviv to create this technique, and which was inspired by a post by Chris Webb (so many people!). Tune in to learn more!
Identifying & Optimizing DAX Patterns (Case-Study) - 01/02/2024
Walk through a client case-study with me as I identify and optimize repeating DAX patterns. The end result having less lines of code, simpler logic, and faster performance. Tune in to learn more!


