Posts filed under Livestreams

(Livestream Replay) Power BI CI/CD, the REST API, and VSCode - with Gerhard Brueckl

DESCRIPTION ๐Ÿ“„

Since its release in 2015, Power BI has quickly become one of the major and widest spread reporting tools on the market. It is used for self-service BI, team BI and also enterprise BI solution of which especially the latest has very specific requirements when it comes to managing deployments and releases. We would like to discuss the typical use-cases and problems that you will encounter when trying to use the traditional approaches for CI/CD and release management with Power BI.

GUEST BIO ๐Ÿ‘ค

Gerhard is a data solution architect at Paiqo GmbH in Austria. He has been working with Microsoft Data & BI tools for over 15 years and is still continuously learning. In all those years he was always shared his knowledge with the community in forums, his personal blog or when speaking at conferences or user groups. Over the last years he focused more on big data and cloud processing in Microsoft Azure but always maintained the link to his roots in BI.

RELATED CONTENT ๐Ÿ”—

Twitter
Blog
LinkedIn
GitHub

Posted on June 6, 2023 and filed under Livestreams, Admin & Management, Azure, Security.

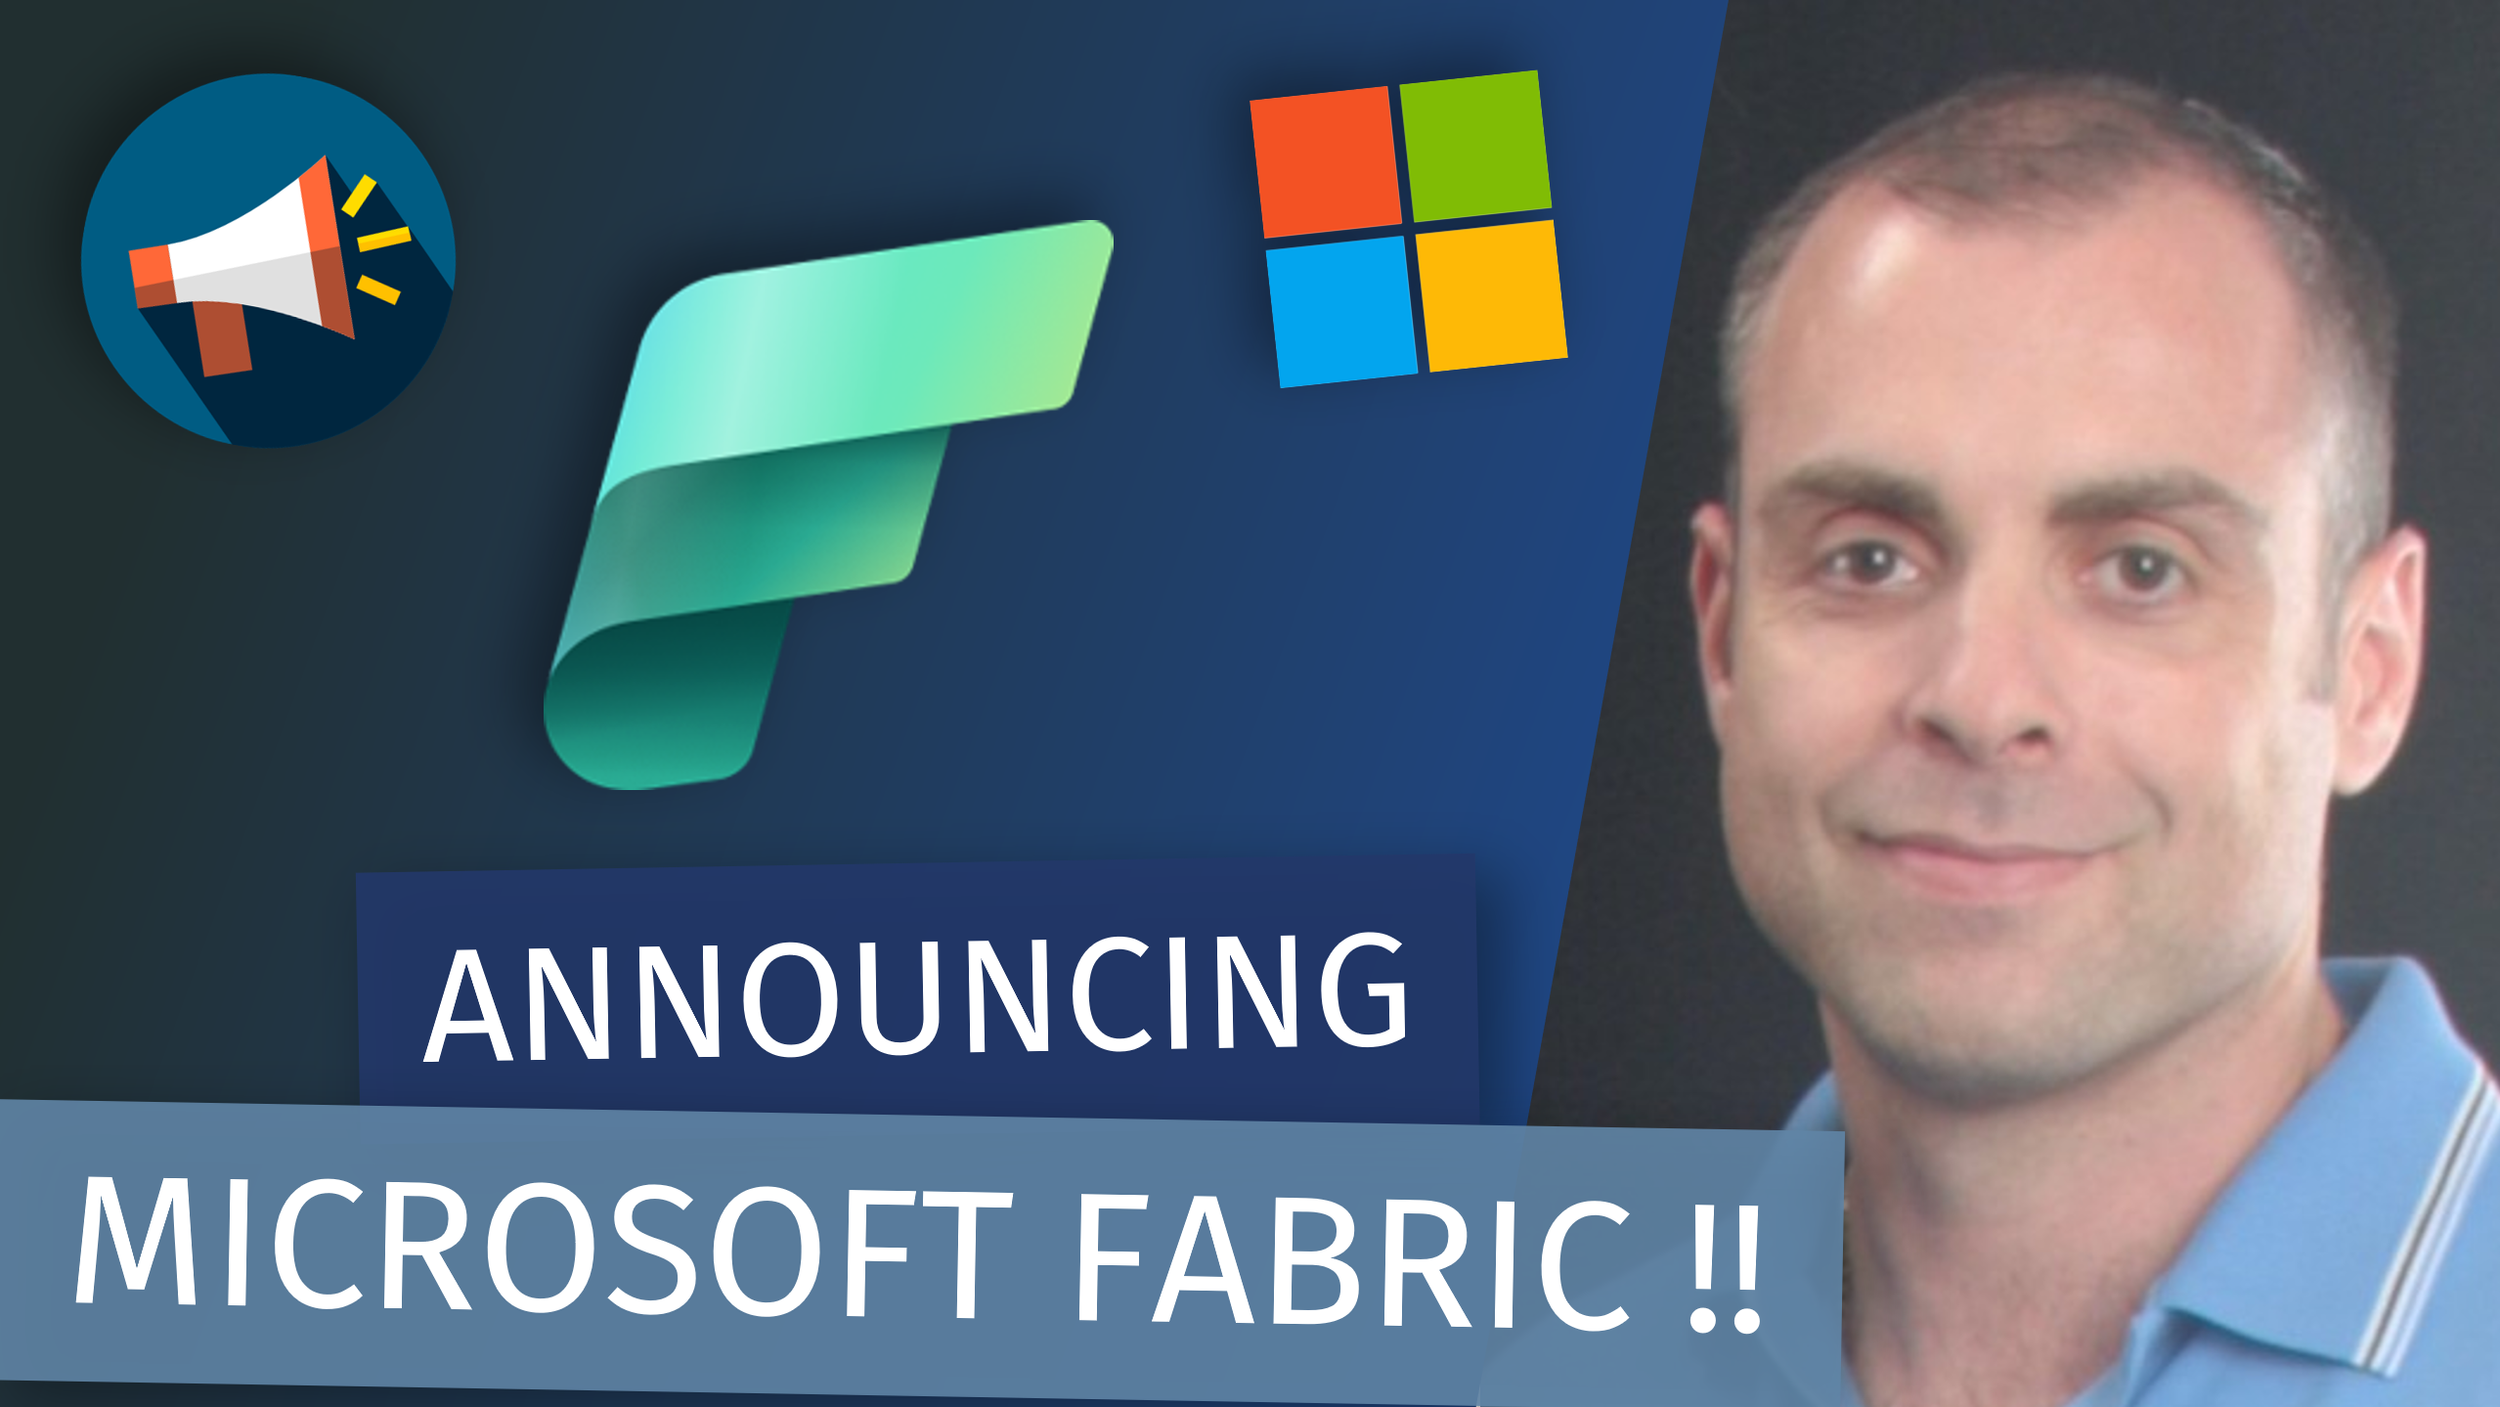
(Livestream Replay) Empower BI Professionals to Do More Using Microsoft Fabric - with Christian Wade

ABSTRACT ๐Ÿ“„

As the volume and complexity of data continue to increase, organizations are constantly looking to uncover insights in faster ways. Join us to learn about Power BIโ€™s exciting new announcements that enable data professionals to gather insights at blazing fast speeds with Microsoft Fabric.

GUEST BIO ๐Ÿ‘ค

As Principal Group Product Manager in the Power BI group, Christian manages a team of program managers responsible for enterprise modeling features across Microsoft's BI product portfolio. He drives product strategy, feature prioritization, planning, design, execution, customer engagement and business results by making Power BI, the most successful BI platform on the planet, even better for the biggest enterprise customers.

Christian is also a renowned public speaker and a regular keynote feature in some of Microsoftโ€™s largest events. Known for awesome demos to engage the audience, drive awareness and usage. Consulting experience driving BI, data warehousing and application development projects for enterprise customers dating back to 1999.

Creator of the BISM Normalizer, a diff & merge tool for Analysis Services tabular models.

RELATED CONTENT ๐Ÿ”—

Microsoft Fabric
Christian's Blog
Data God Page
BISM Normalizer

Posted on May 26, 2023 and filed under Livestreams.

(Livestream Replay) Better Maps in Power BI with ICON MAP - with James Dales

DESCRIPTION ๐Ÿ“„

Have you ever had requirements to do more with maps than you can achieve with the out of the box Power BI visuals? The Icon Map custom visual was created to fill these feature gaps, and enable more advanced capabilities, such as drawing images, lines and polygons on maps. James will walk us through demos showing the features and how to configure them.

GUEST BIO ๐Ÿ‘ค

James Dales is the Global Capability Lead for Power BI at Avanade and is a Microsoft FastTrack Recognised Solution Architect. As a Microsoft Data Platform MVP he is the co-leader of the London Power BI user group. In 2019 he became the first member of the Power BI Contributors Program, working alongside the Microsoft engineering team to build new functionality into the product itself. He has a keen interest in spatial analytics and is the author of the Icon Map custom visual.

RELATED CONTENT ๐Ÿ”—

Icon Map
LinkedIn

Posted on May 16, 2023 and filed under Livestreams, Beginner, Visualizations, Custom Visuals.

(Livestream Replay) Create ANY Visual in Power BI with the HTML VizCreator - with Pascal Kiefer

ABSTRACT ๐Ÿ“„

Every Power BI developer has come across business requirements which were impossible or difficult to achieve using the Power BI core visuals. The HTML VizCreator custom visual puts an end to this!

Learn from the creator of the visuals that even with little to no HTML knowledge, you can create all sorts of custom visualizations. The combination of DAX and HTML will give you a ton of new possibilities and can also help to improve report performance. With the HTML VizCreator visuals you can create custom KPI cards, highly complex tables, dynamic text boxes but also custom bar/column charts, any kind of infographics and many other elements.

One of the many 5-star-reviews on AppSource is titled โ€œThe Do-Everything Visual!โ€ which is exactly right, we can really use these visuals for nearly anything. In this hands-on session, we will show how to create different elements from scratch without the need to write any HTML code.

As a bonus, we will also show how to make phone calls directly from a Power BI report.

GUEST BIO ๐Ÿ‘ค

Pascal Kiefer is the founder of BI Samurai, a company based in Switzerland that mainly implements Power BI solutions for clients from all industries across the globe. Having worked with hundreds of clients, the BI Samurai team became very well aware of the limitations of native Power BI and wanted to fill this gap. With the HTML VizCreator custom visuals, this has been achieved.

RELATED CONTENT ๐Ÿ”—

BI Samurai Website
LinkedIn Pascal
LinkedIn BI Samurai
YouTube
HTML VizCreator Cert
HTML VizCreator Flex
Download sample reports
Online HTML editor
Knowledge Base
Bridger (PBI Phone Calls)